Every service, watched from the inside.
ServiceWatch runs synthetic checks against your endpoints — HTTP, TCP, ping, DNS and heartbeat — confirms outages before it pages anyone, and reports the SLOs you're actually held to. From inside the network. No SaaS, no agents on targets.
- HTTP · TCP · ping · DNS
- Incidents & SLOs
- Air-gap friendly
Everything between a probe and a page.
Services fail where external monitors can't reach. ServiceWatch checks them from inside your perimeter, confirms what's real, and reaches the right person — without the false alarms.
Synthetic Monitoring
Five check types — HTTP/HTTPS, TCP-connect, ICMP ping, DNS and push/heartbeat — with per-stage timings (DNS, connect, TLS, TTFB) and TLS telemetry on every HTTPS probe.
False-Alarm-Resistant Alerting
A confirmation state machine — N consecutive failures before down, recovery hysteresis, geometric escalation re-alerts and maintenance-window suppression. Single blips never page.
Incident Timelines
Incidents open automatically on a confirmed outage and resolve on recovery — severity, duration, acknowledge / resolve and a postmortem on each one.
SLO & Error Budgets
Per-monitor uptime, SLO target, error-budget burn rate and p95 / p99 latency across 7-, 30- and 90-day windows.
Status Pages
Publish a read-only status page — grouped services, uptime history, custom domain and email subscribers — hosted entirely on your own infrastructure.
Real User Monitoring
Drop in one browser beacon snippet to capture real page-load, TTFB and DOM timings from actual visitors — alongside the synthetic checks.
AI Intelligence
Fleet narrative, anomaly detection, failure predictions and an "Ask the NOC" natural-language console. Point it at any OpenAI-compatible model, or run the deterministic heuristic fallback.
On-Call Paging
On-call rotations that page the current responder by email and — when configured — Twilio SMS, plus a voice call for critical incidents.
Multi-Channel Alerting
Telegram, Slack, Microsoft Teams, HMAC-signed webhooks and email — each with minimum-severity and tag-based routing.
Mission-Control Wall & Passive Discovery
10A full-bleed NOC wall display — service constellation, heatmap and live heartbeats for the big screen — plus passive subdomain discovery from public Certificate Transparency logs (crt.sh / certspotter, with optional Amass).
From a 5-second tick to the right person paged.
One in-process scheduler drives the whole loop — no external queue, no message broker, no agents on your targets.
- 01
Schedule
A 5-second scheduler with an 8-worker pool picks every monitor whose check interval has elapsed.
- 02
Probe
Each worker runs the check — HTTP, TCP, ping, DNS or heartbeat — capturing per-stage timings and TLS handshake details.
- 03
Record
Every result lands in a time-series: status, latency, status code, TLS version, cipher and region.
- 04
Confirm
A debounce state machine needs consecutive failures to flag down and consecutive successes to recover. Blips never flip status.
- 05
Incident
A confirmed transition opens one incident per service; a confirmed recovery resolves it automatically.
- 06
Notify
Maintenance and multi-region consensus gates run first, then alerts fan out to channels, status-page subscribers and on-call.
Real screens, real signal.
Everything below is the actual ServiceWatch UI, captured live — not a mockup.
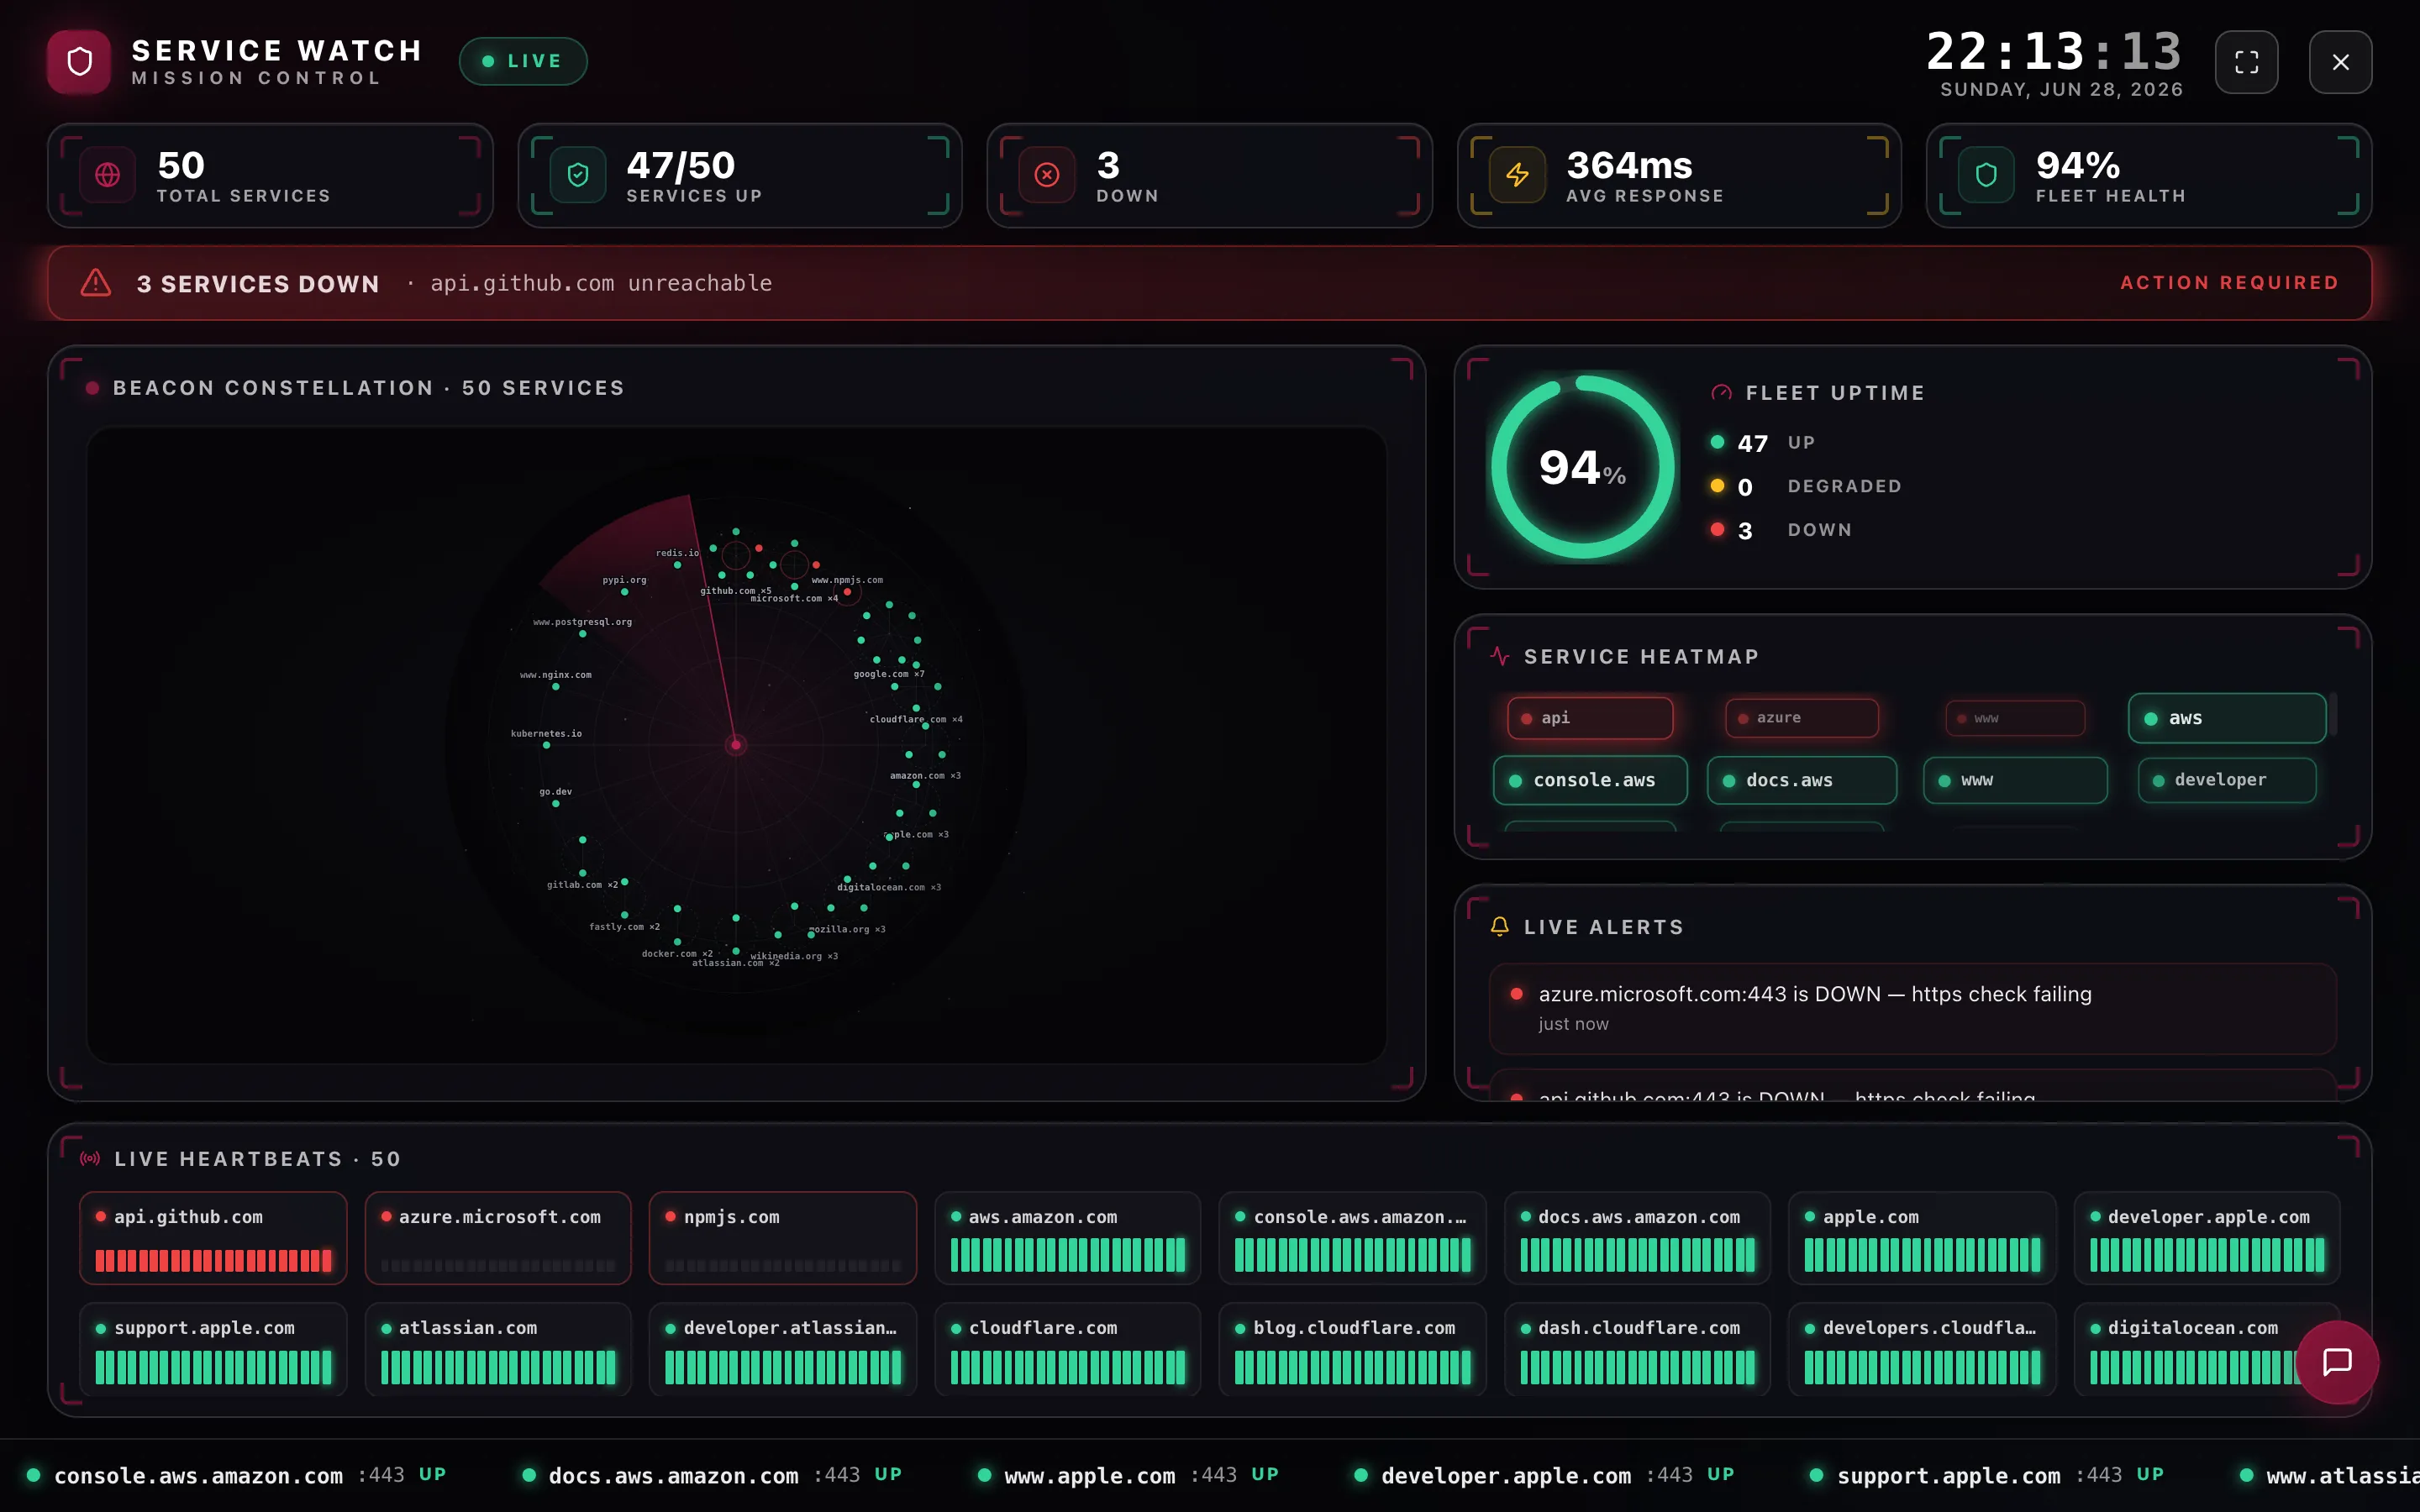
Your whole fleet on one screen.
Group services, watch uptime and latency in real time, and drill into any monitor for per-stage timing and TLS detail. Card grid, constellation map or heatmap — your call.
- Five probe types — HTTP, TCP, ping, DNS, heartbeat
- Per-stage timing — DNS · connect · TLS · TTFB
- Live TLS version, cipher and certificate fingerprint
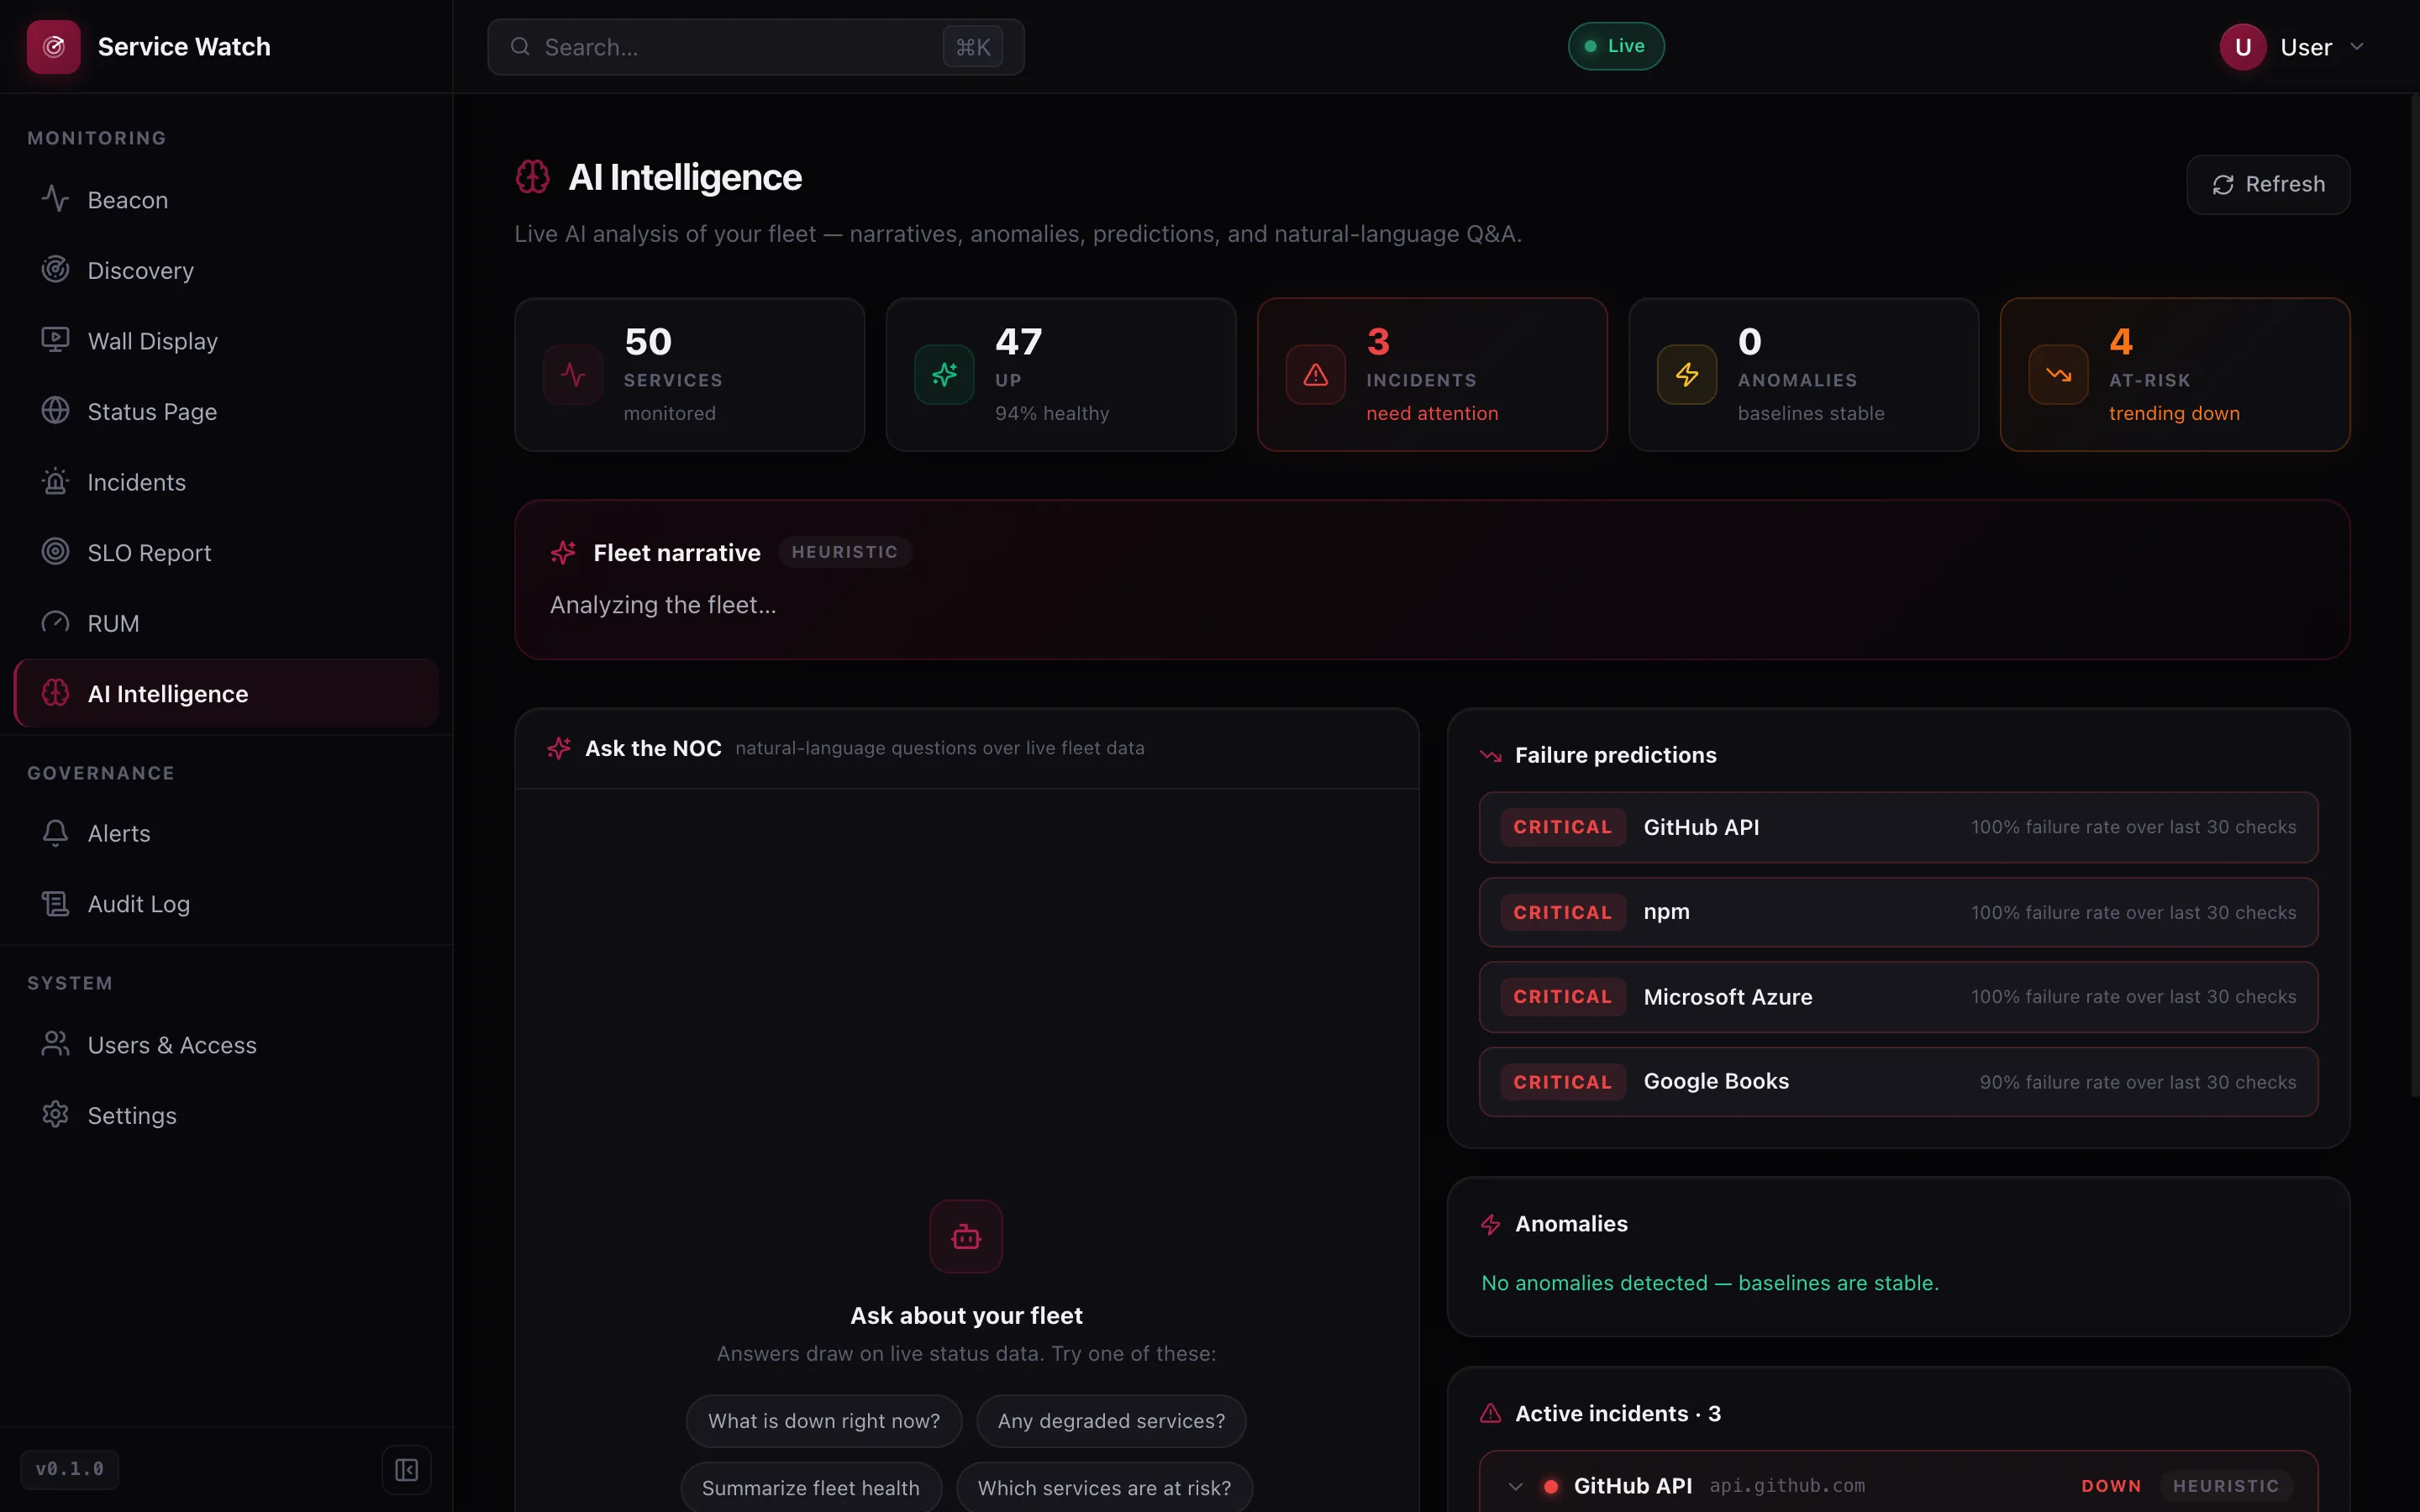
An on-call analyst that never sleeps.
A live fleet narrative, anomaly detection and failure predictions — plus an "Ask the NOC" console you can query in plain English. Point it at any OpenAI-compatible model, or run the built-in heuristics fully offline.
- Failure predictions ranked by recent failure rate
- Baseline anomaly detection
- Natural-language Q&A over live status
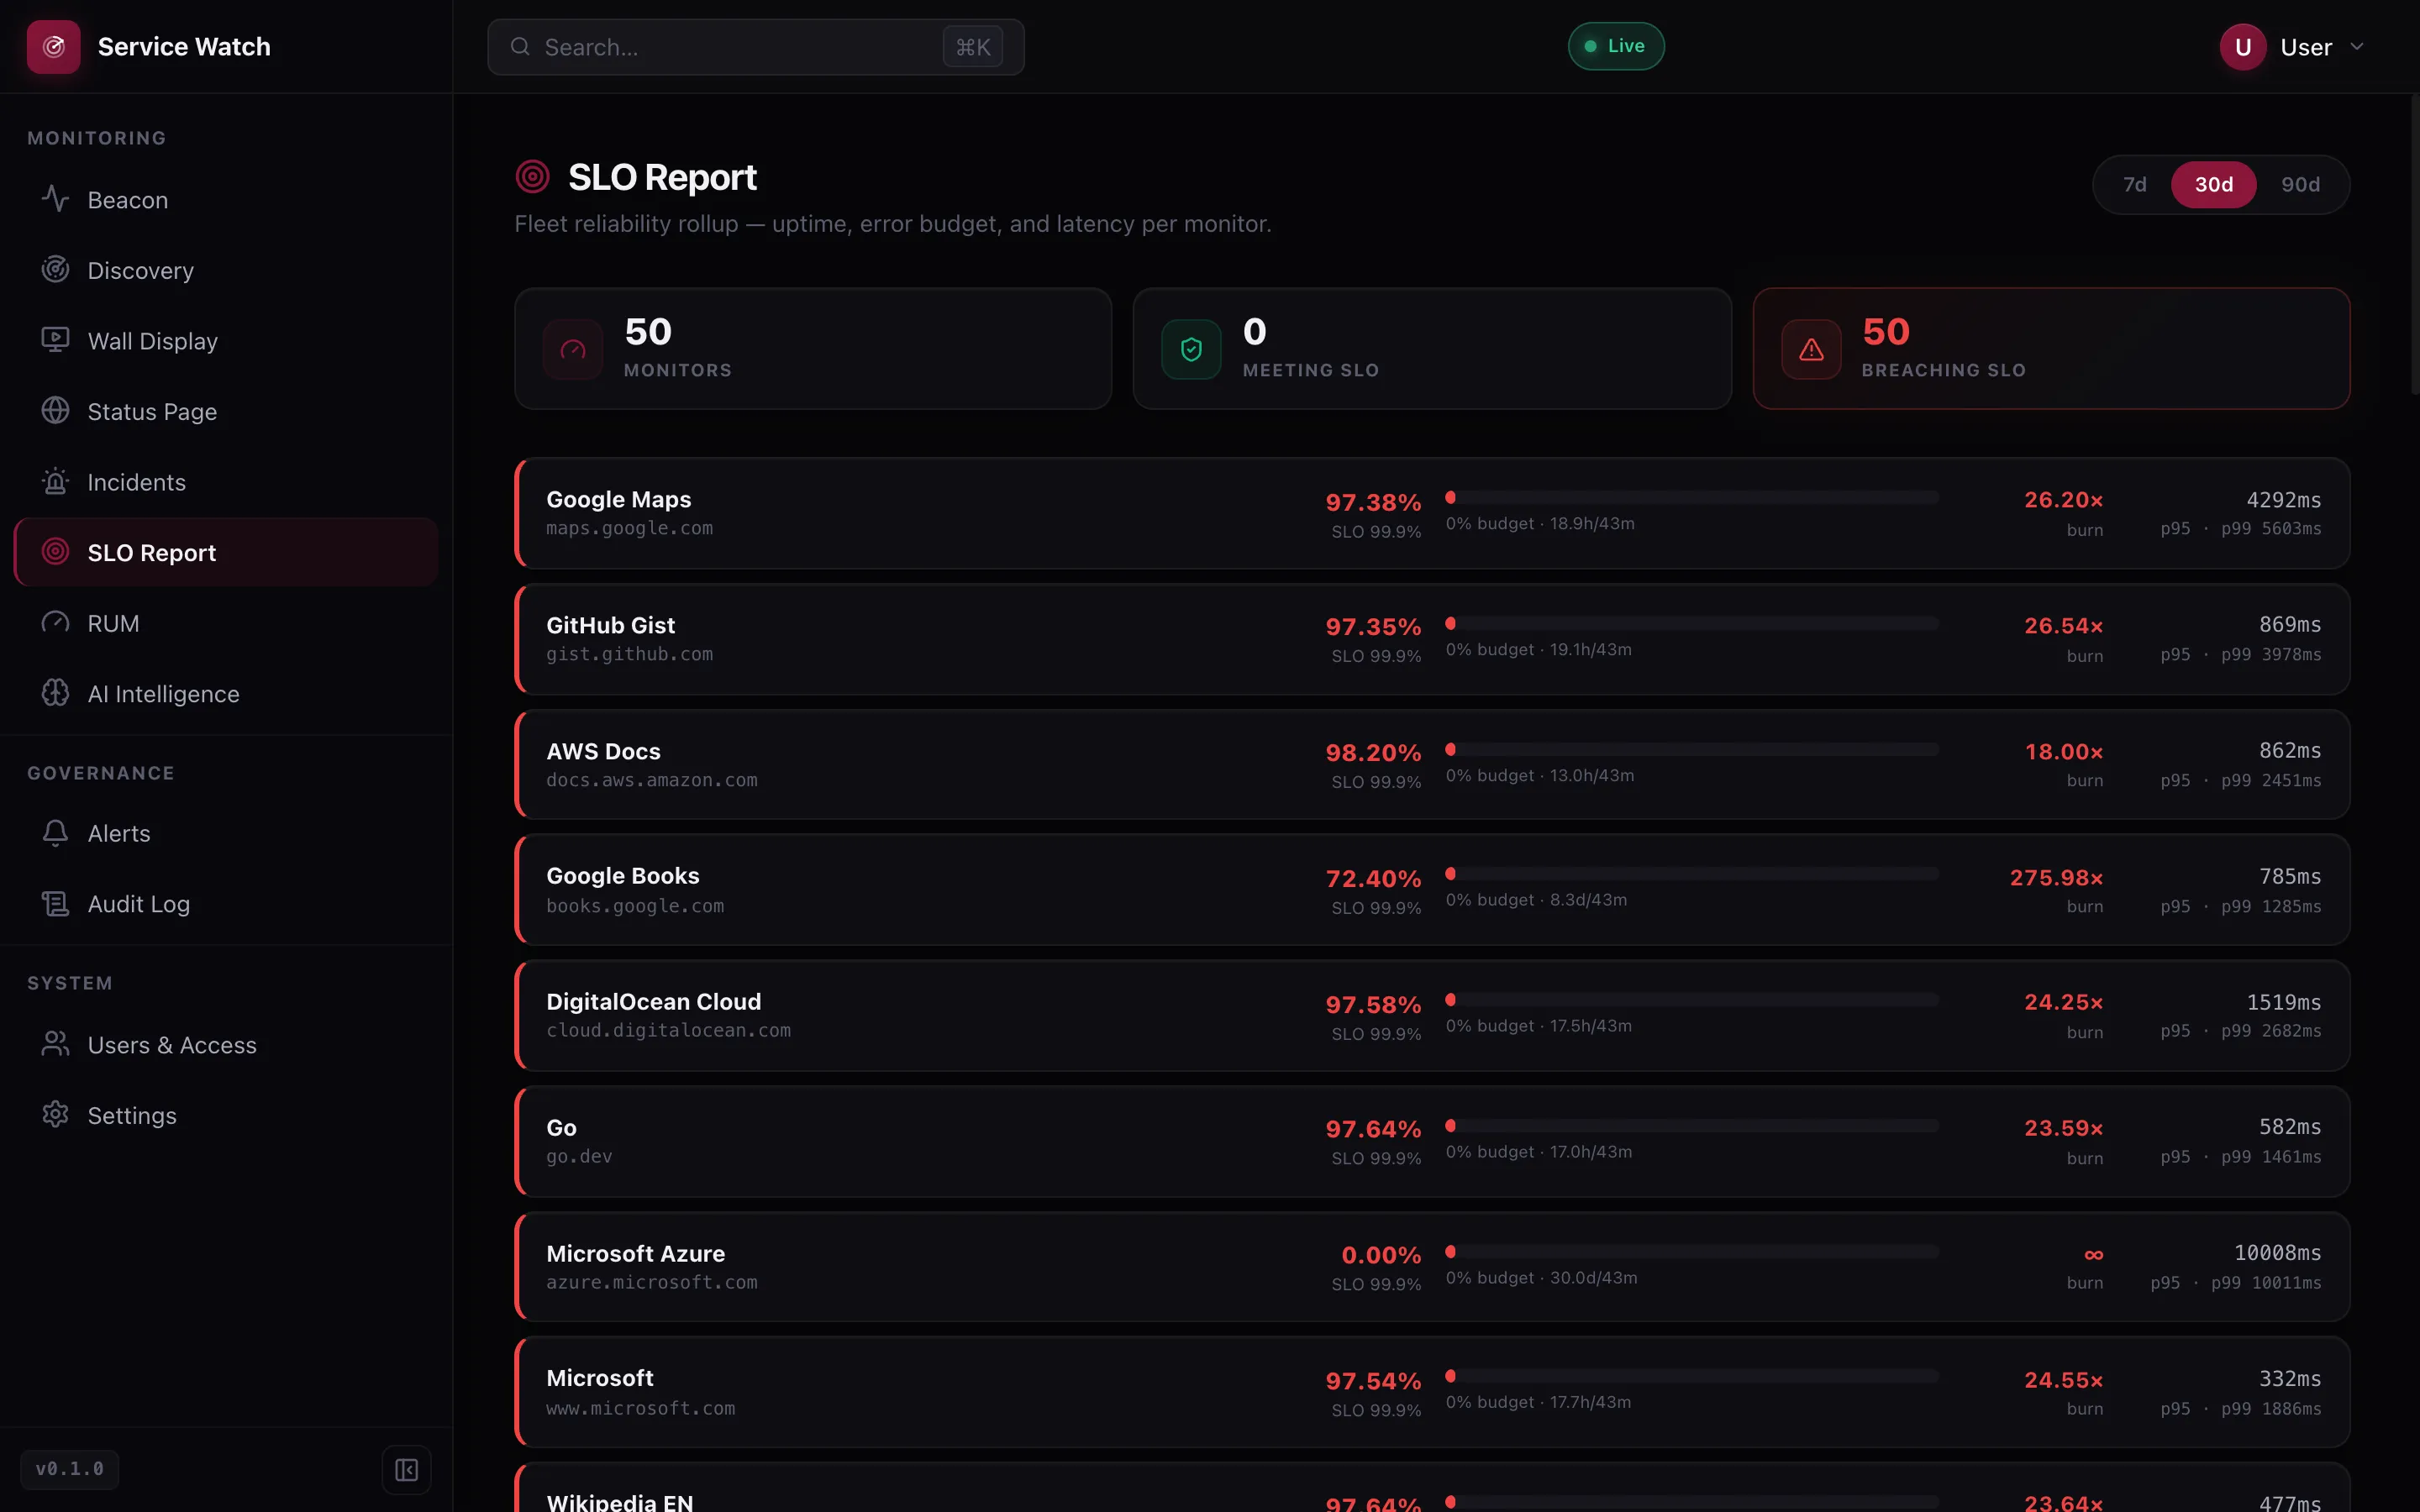
The numbers you actually report on.
Every monitor carries its own uptime, SLO target, error-budget burn rate and p95 / p99 latency across 7-, 30- and 90-day windows. An SLA review becomes a click, not a spreadsheet.
- Per-monitor error budget and burn rate
- p95 / p99 latency
- 7 / 30 / 90-day windows
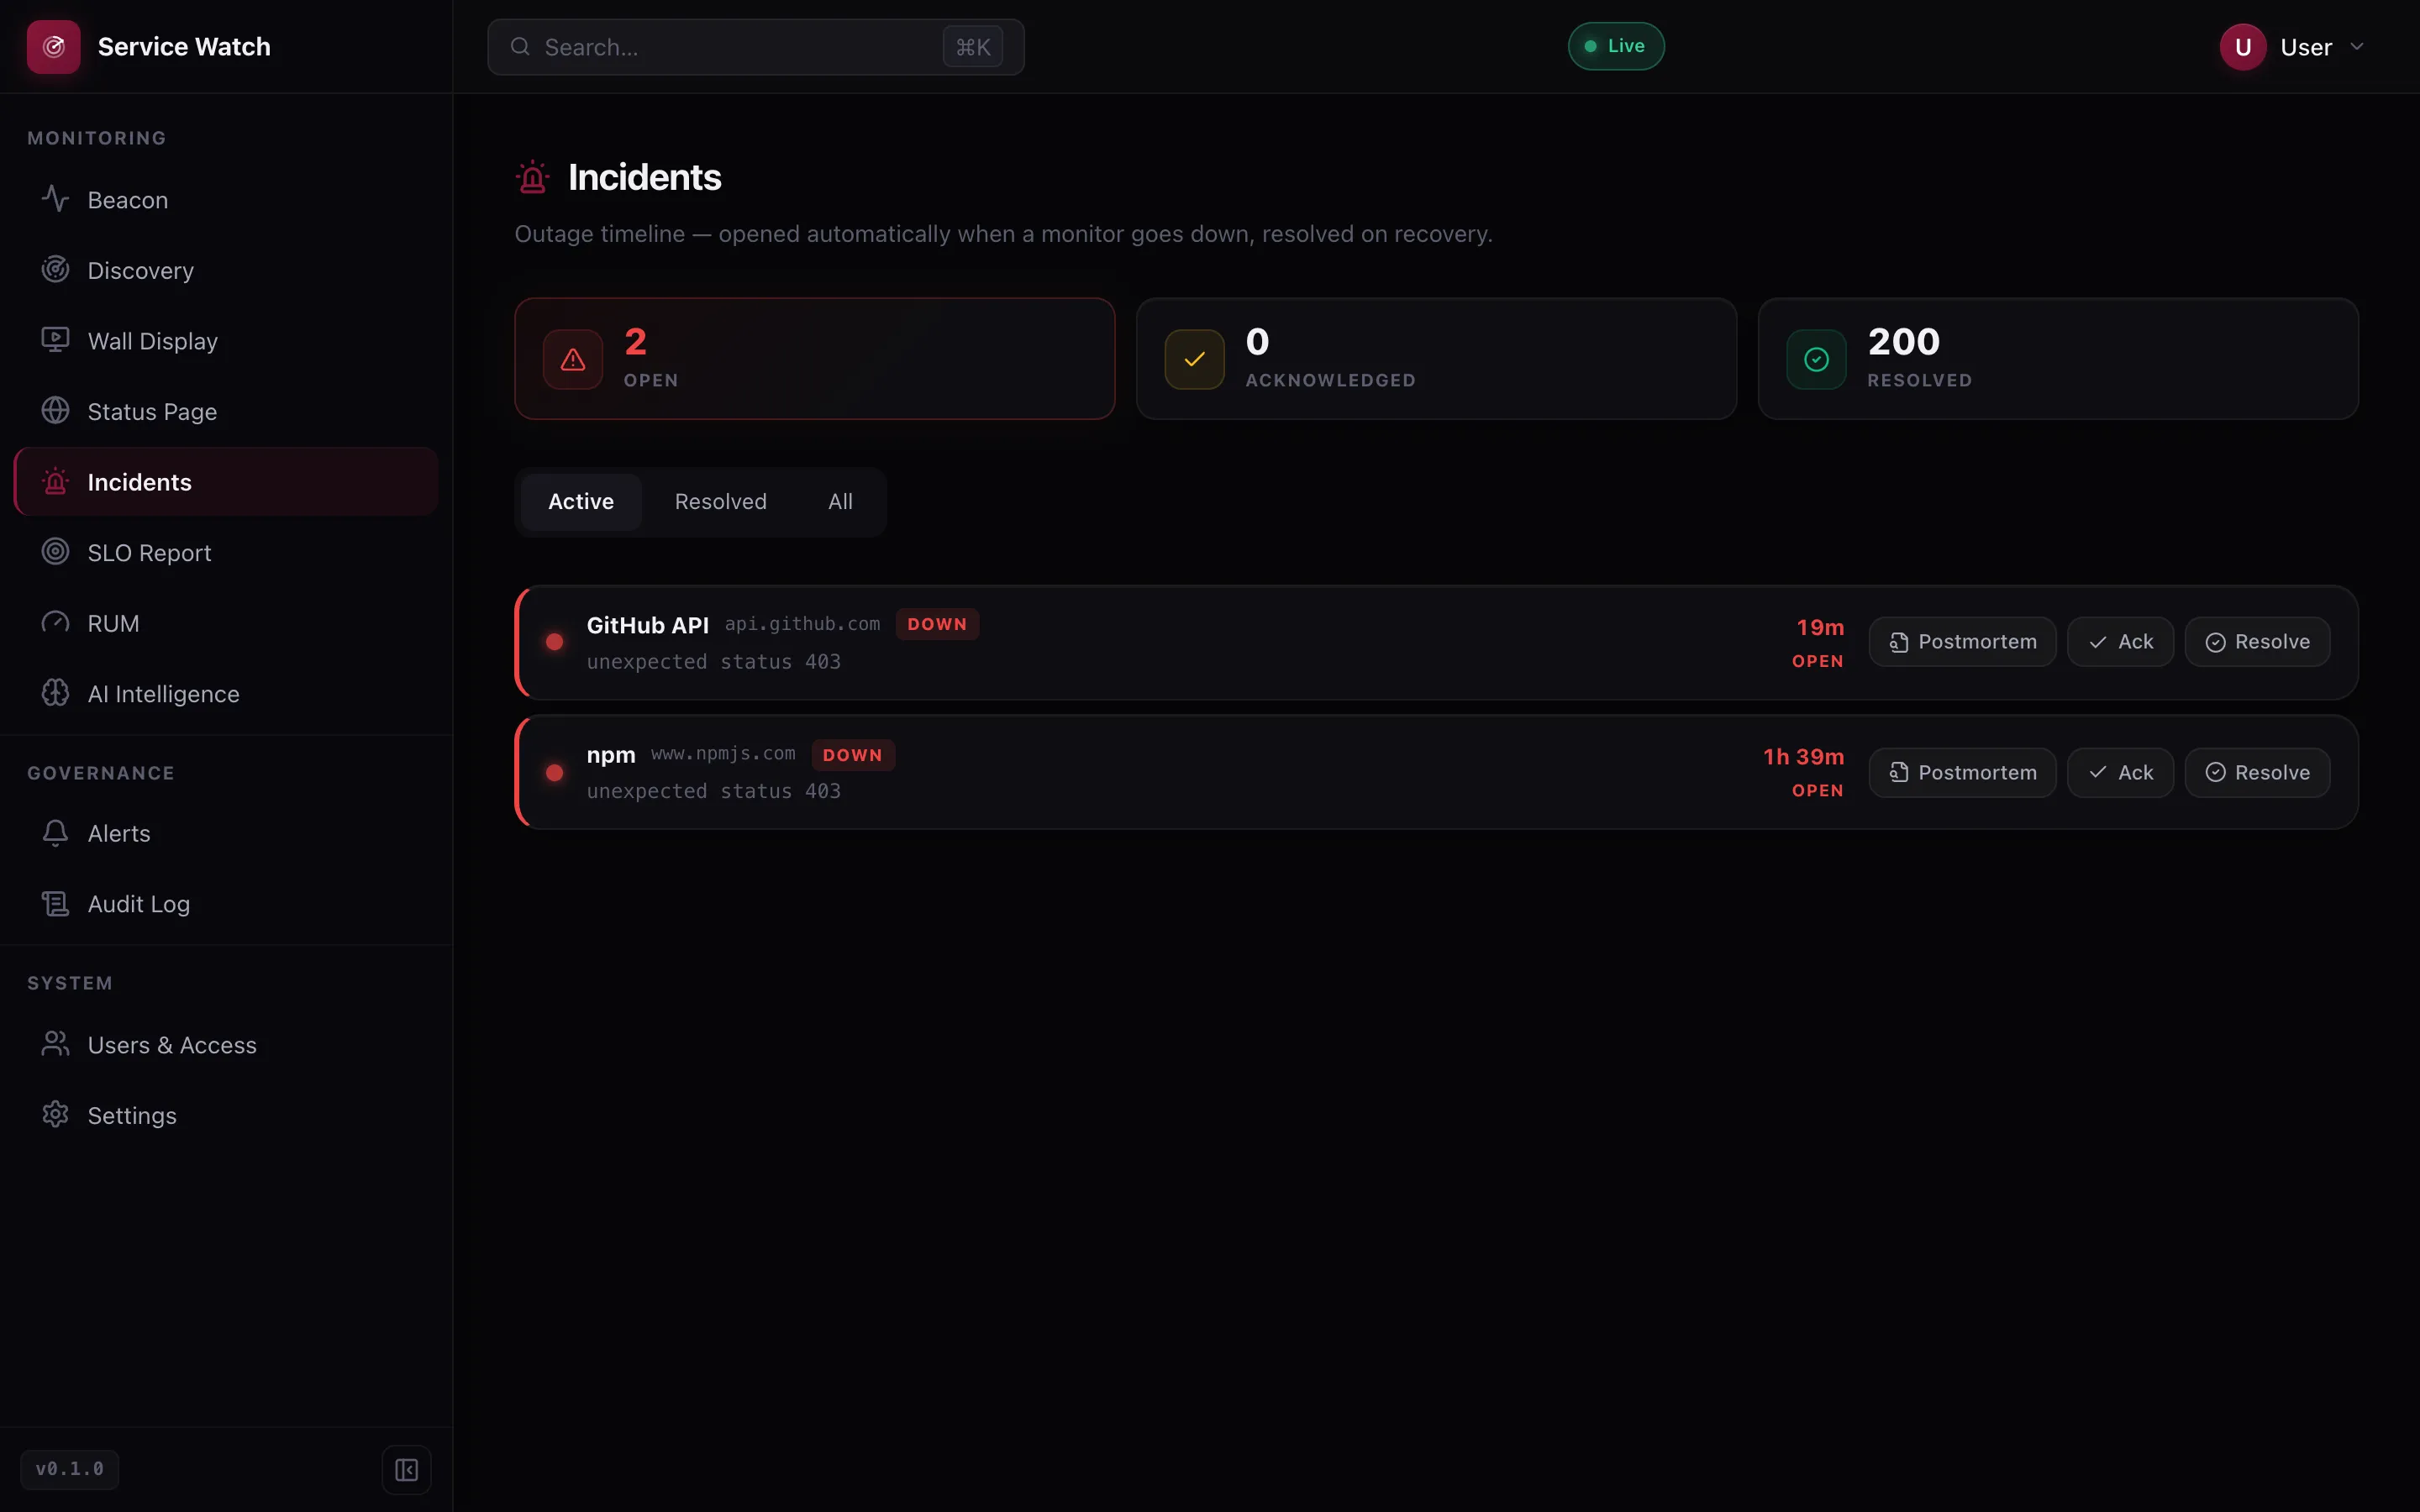
Incidents that manage themselves
Outages open automatically and resolve on recovery — severity, duration, acknowledge, resolve and postmortem.
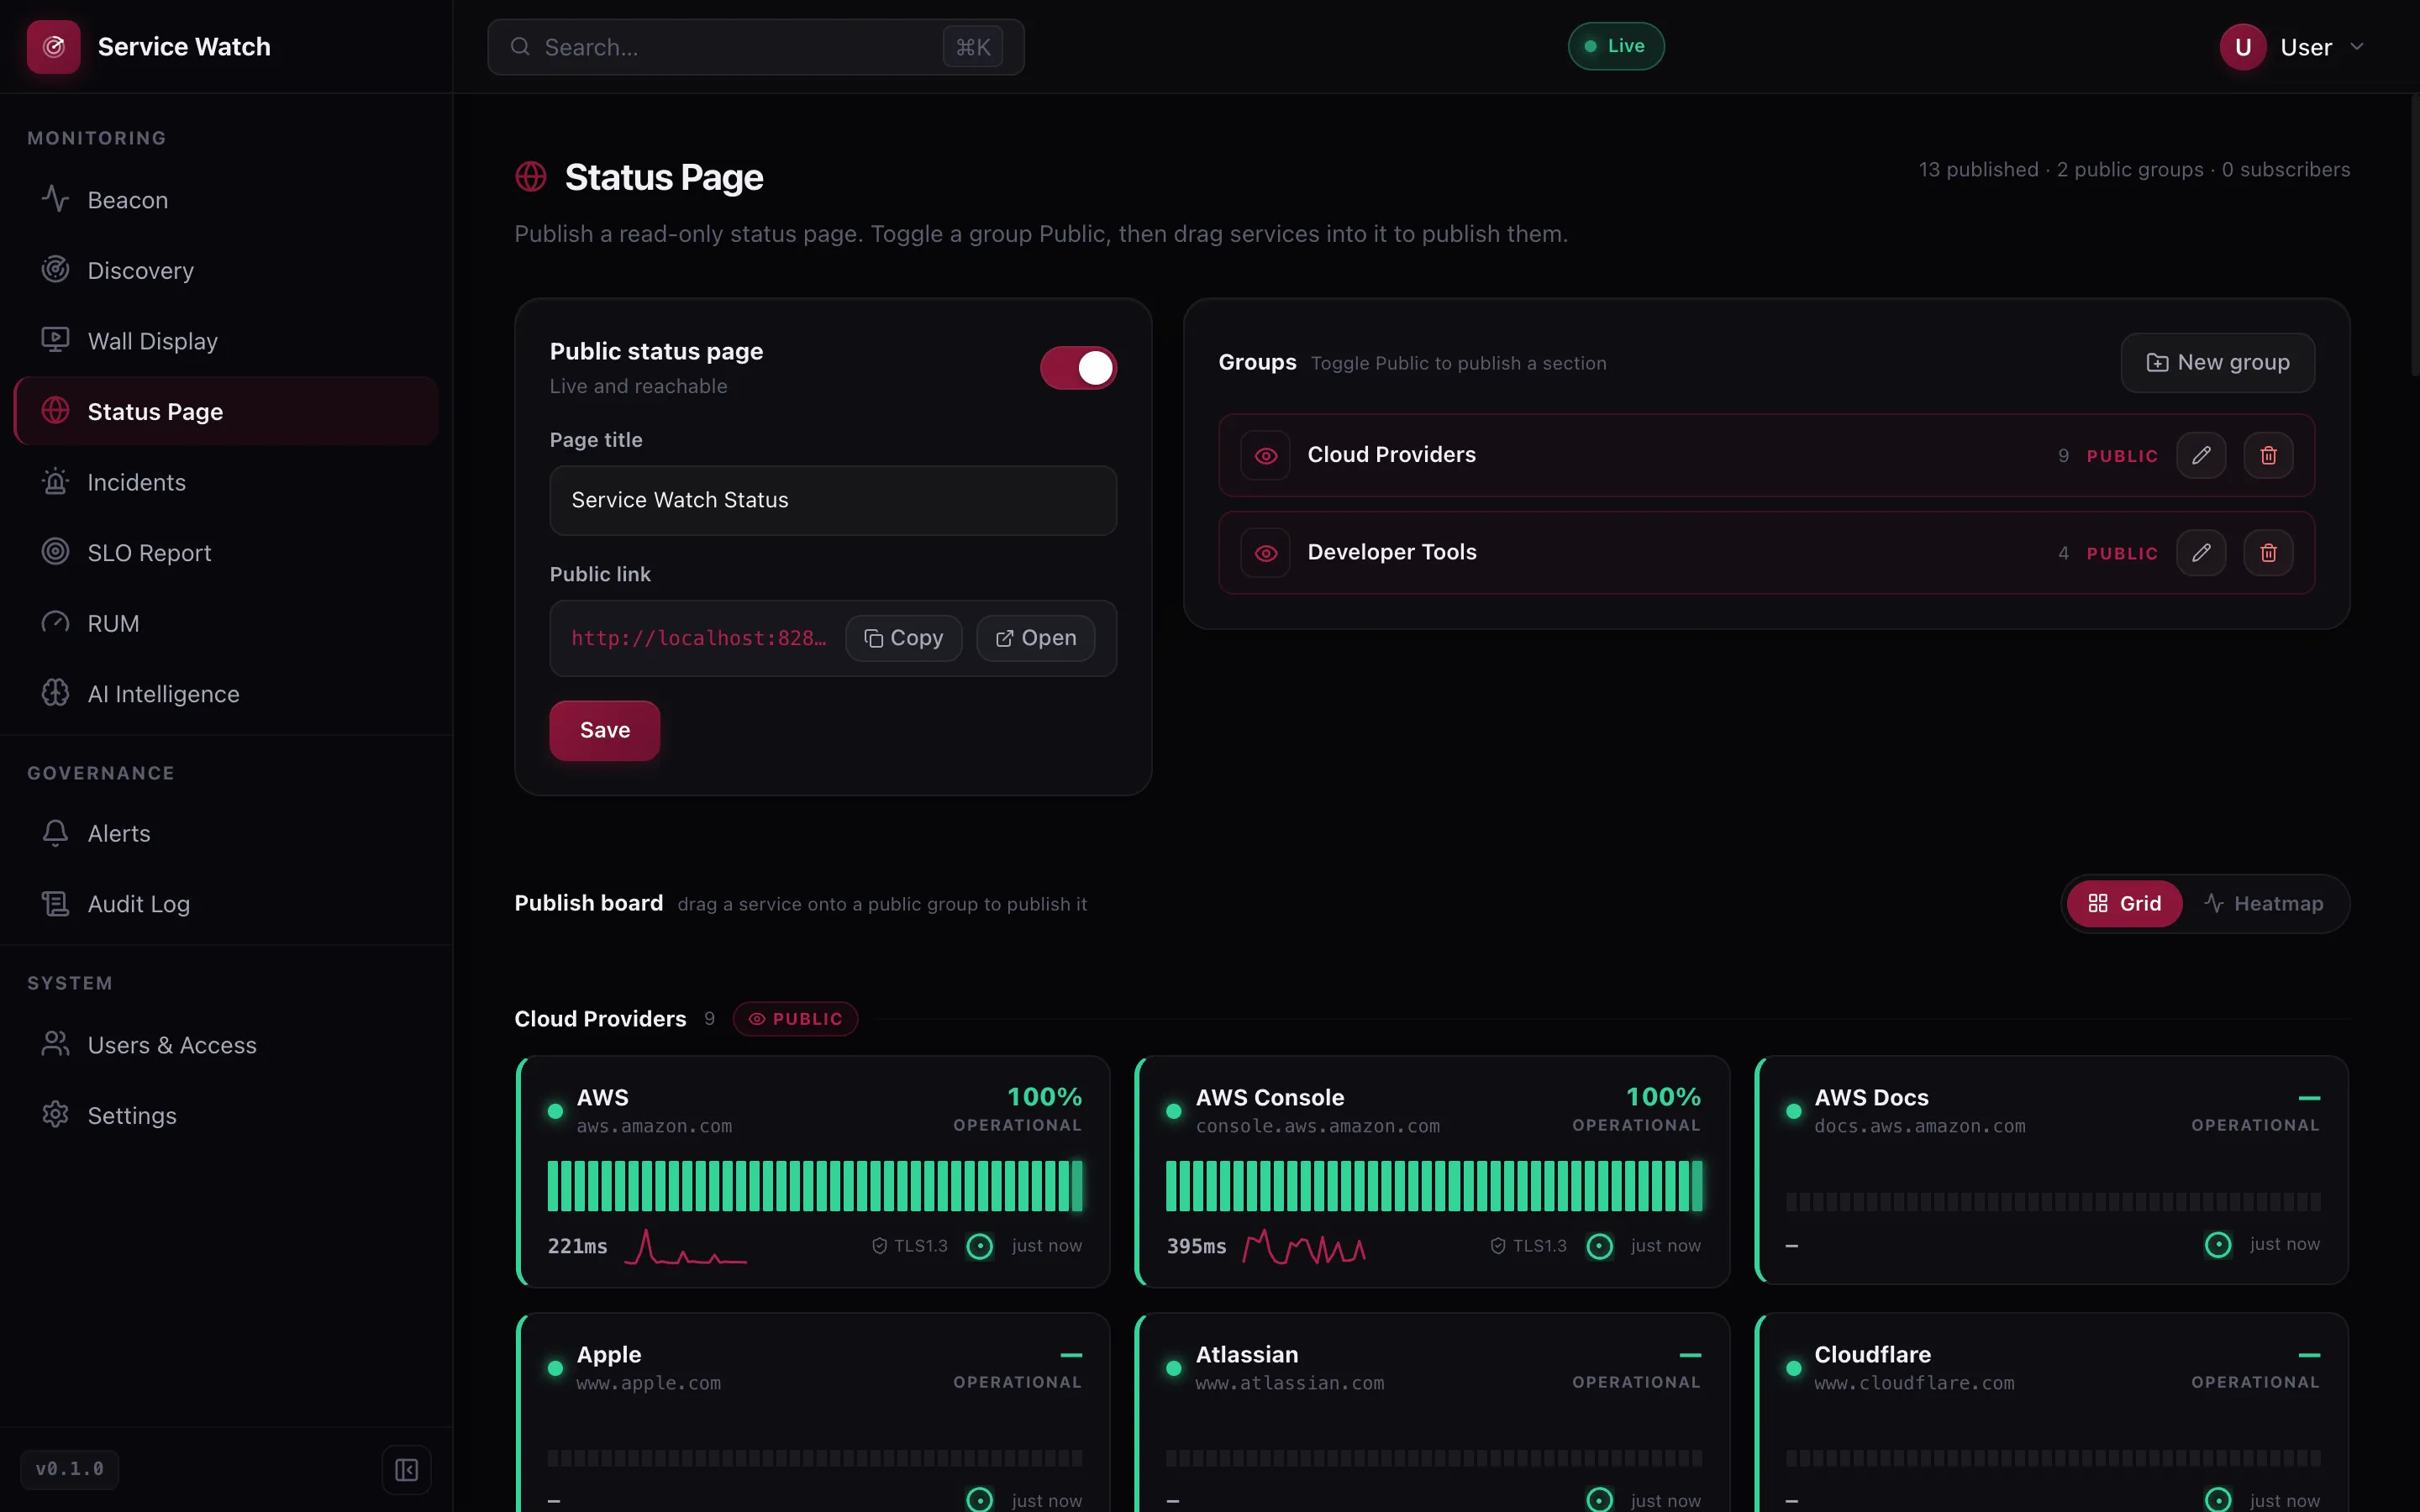
Status pages on your domain
Publish a read-only status page with grouped services, uptime history and email subscribers.
The numbers you actually report on.
Every service carries its own uptime history and error budget, so an SLA review is a click, not a spreadsheet. Synthetic and real-user signal in one place.
Probes run inside your network.
External monitors can't see internal APIs, brokers or mesh services. ServiceWatch checks them from within the perimeter — and the data never leaves it.
No egress, no SaaS
Nothing phones home. Runs fully offline, air-gap friendly.
On-prem deploy
One docker compose up — Postgres, API, web and nginx. systemd units included.
Auth & tenancy
Local, LDAP/AD and OIDC SSO with TOTP 2FA; RBAC, API tokens, audit log, multi-org.
Status on your domain
Self-hosted status pages — public or strictly internal.
# clone & configure
git clone https://github.com/up99/servicewatch.git
cd servicewatch && cp .env.example .env
JWT_SECRET=$(openssl rand -hex 32)

# launch the stack
docker compose up -d

✓ api      migrations applied
✓ beacon   synthetic checks running
✓ web       https://localhost:8543 → /setup
Watch every service before users do.
Open source, self-hosted, $0. Pairs with certwatch under one up99 control plane.